
LM–79 Testing Labs
Power India Services is leading service provider of LM79 Testing Services. If you are looking an experienced Vendor for your LED lighting equipment’s Testing and Certification then you are on the right page for it. Here we are mentioning the detailed information for LM-79 Testing.
LM-79 testing captures performance characteristics of products that feature solid-state lighting (SSL) technology, including light-emitting diodes (LEDs). This testing provides a snapshot of performance under specified operating conditions at some point in the life of a product, usually at the beginning of operation— these are referred to as initial measurements. It does not address lifetime ratings, changing performance over time (e.g., lumen maintenance), or LED case temperature.1 The LM-79 method is applicable to integrated LED products, such as luminaires and replacement lamps.
It is not applicable to LED packages, modules, or arrays (herein collectively referred to as LED light sources).
LM-79 data enables objective product comparisons, allows for evaluation relative to performance requirements, and is required by voluntary labelling programs such as LED Lighting Facts and ENERGY STAR.3 Although LM-79 does not prescribe a report format or the minimum content, a substantial list of “typical items reported” is provided. Key types of measurements addressed in the document include electrical characteristics, lumen output, spatial distribution of light, and color attributes. The DOE fact sheet, “LED Color Characteristics,” is dedicated to a discussion of color-related metrics that may be included in LM-79 reports.
Electrical Characteristics
Electrical Characteristics A variety of electrical measurements may be conducted as part of LM-79 testing, including but not limited to:
- Input voltage, expressed in volts (V). Testing is performed with the SSL product operated at its rated input voltage.
- Input current, expressed in amperes (A). Input current can be either direct current (DC) or alternating current (AC), depending on product design. Note that this metric is not equivalent to the current supplied to a given LED light. source (i.e., LED drive current), which often cannot be measured directly without damaging the product.
- Input power, expressed in watts (W). Input power is essential for determining energy savings.
- Power factor (PF), is a power quality metric reported as a unitless decimal value between zero and one. PF is calculated by dividing input power by the product of input voltage and input current.
Lumen Output and Luminous Efficacy
Light output—more formally referred to as luminous flux—is expressed in lumens (lm). Lumen output is a more meaningful metric than input power when establishing product equivalency because the ratio of total lumen output to input power can differ from product to product.6 This quotient is termed luminous efficacy and is expressed in lumens per watt (lm/W)
Spatial Distribution of Light Once
The total lumen output of an SSL product has been determined; it is important to understand where the light is directed. More light is not necessarily of benefit if it is not delivered where it is needed; thus, total lumen output should only be used to compare products which distribute light in a similar manner. Luminous intensity, expressed in candelas (cd), is measured at a variety of angles to enable characterization of the spatial distribution of light. This intensity data is then used to calculate a variety of metrics and to generate diagrams that might be found in photometric reports, depending on the type of product and the intended application. Common examples of such metrics and diagrams include polar plots of luminous intensity, zonal lumens and BUG ratings, luminance of lamp or luminaire, beam and fi eld angles, spacing criteria, and is illuminance plots.
. Polar Plots of Luminous Intensity
. Zonal Lumens and BUG Ratings
. Luminance of Lamp or Luminaire
Beam and Field Angles
Directional lamps (e.g., PAR or MR lamps) are typically characterized on the basis of beam angle and centre beam intensity, due to the rotational symmetry of the luminous intensity distribution about the centre beam axis. In other words, the projected pattern of light—which is circular if directed perpendicular to the surface—does not change as the lamp is rotated about its axis. 11 Similarly, floodlight luminaires featuring luminous intensity distributions that exhibit quadrilateral symmetry (elliptical pattern) are often classified on the basis of field angles measured in the two orthogonal planes of symmetry. 12 Beam angle and field angle are calculated as twice the angle (from center beam) where intensity is 50% or 10% of the maximum value, respectively. 13 For example, the cosine distribution in Figure 1 would yield relatively wide beam and field angles of 120° and 169°, respectively.
LM-79Test Method and Apparatus
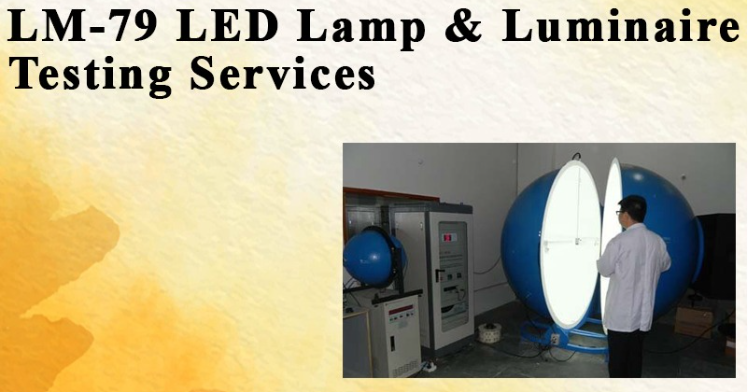
The content of a given LM-79 report depends in part on the apparatus used for measurement. Using an integrating sphere, the total lumen output of a tested source is captured in a single measurement (see Figure 5). An integrating sphere is also the most common apparatus for capturing colorimetric data. By contrast, using a goniophotometer, luminous intensity measurements are recorded at a series of locations surrounding the test sample and then total luminous flux is calculated. Some goniophotometers may have the capability, but most do not measure colorimetric performance. Given the different capabilities of the two methods, both of which are documented in LM-79, the content of photometric reports may vary. For example, if only the integrating sphere method was used, the report will not characterize the spatial distribution of light. Similarly, if only the gonio photometry method was used, the report is unlikely to include color metrics. Notably, if both the integrating sphere and gonio photometry methods have been used, then two sets of values may be provided. In some cases, the same metrics will be included for both methods (e.g., lumen output or luminous efficacy), and the values may differ somewhat due to measurement uncertainties.
Use of LM-79 Test Data
The metrics and diagrams included in LM-79 reports can be useful for preliminary product screening. An experienced user may be able identify products that have an appropriate distribution for a specific application, or detect potential problems in terms of uniformity, glare, or obtrusive light. For example, it should be clear that a product with a cosine intensity distribution would direct a greater proportion of its output (50%) behind the luminaire than would the product with the bilaterally-symmetric intensity distribution shown in Figure 2 (33%). In addition, a series of products with a cosine distribution would be less likely to meet uniformity requirements—they might create pools of light directly under luminaires, with relatively dark areas in between—in scenarios such as street lighting, where the distance between luminaires often greatly exceeds the mounting height. Simple metrics and diagrams, however, are easily misinterpreted. A given product cannot be simply characterized as low or high performance—it may perform well in one scenario and poorly in another. Lighting software can be used to overcome this gap by incorporating LM-79 test data (typically using IES-format electronic files), geometric parameters, reflectance characteristics of illuminated surfaces, and the combined contribution of all luminaires in the lighting system. Although LM-79 reports may be somewhat limited in utility, the data gleaned from LM-79 testing enables complete photometric analysis to ensure requirements are satisfied.


